The Executive's Ecommerce Fulfillment Guide: From Strategy to Execution
What Is Ecommerce Fulfillment? The Executive Definition
Your fulfillment operation is hemorrhaging money. Take your annual revenue. Multiply by 0.03. That's what a 3% inventory error rate costs you. For a $40M business, that's $1.2M gone.
Your ecommerce fulfillment process determines:
- Customer lifetime value (87% vs 62% retention)
- Cash conversion cycle (14 days vs 31 days)
- Working capital requirements (18% vs 29% of revenue)
Most executives treat fulfillment as a cost center. Wrong lens. It directly impacts 23% of your total revenue through inventory management, order processing, picking, packing, shipping, and returns.
Good fulfillment adds $4.6M profit on $20M revenue. Bad fulfillment bleeds it away.
I've seen companies transform their P&L by fixing three fulfillment metrics: accuracy rates, cycle times, and inventory turns. The math is simple. A retailer moves from 62% to 87% customer retention by eliminating shipping errors. That's $3.2M in additional lifetime value on their existing customer base.
Your fulfillment operation isn't logistics. It's your profit multiplier.

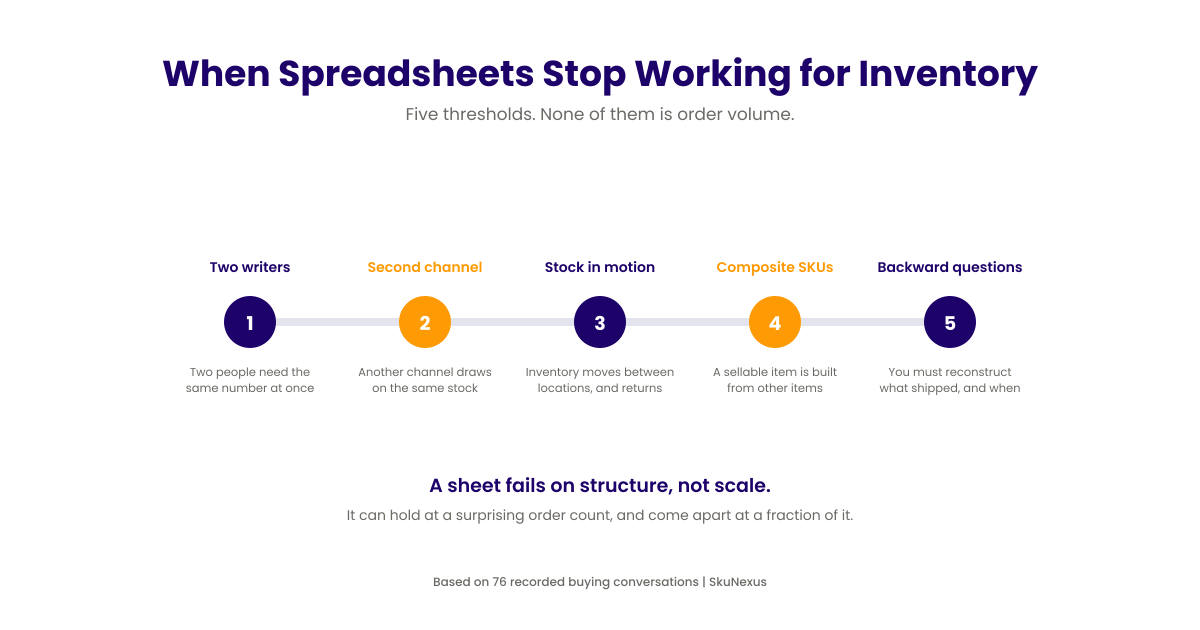
The 6-Step Ecommerce Fulfillment Process That Scales
Your ecommerce fulfillment process breaks at predictable points. At 100 orders daily, it's manual errors. At 1,000, it's picking bottlenecks. At 10,000, it's inventory allocation.
This framework handles 10x volume growth without breaking:
- Receiving: 2-hour dock-to-stock (industry average: 24 hours)
- Storage: 85% space utilization (average: 65%)
- Processing: 15-minute order-to-pick (average: 45 minutes)
- Picking: 99.7% accuracy (average: 97%)
- Shipping: Same-day cutoff at 5PM (average: 2PM)
- Returns: 24-hour processing (average: 5-7 days)
📷 Ecommerce fulfillment process diagram showing 6 steps with efficiency metrics
Hit these numbers or lose to competitors who do.
Step 1: Receiving That Prevents 90% of Downstream Issues
Every fulfillment error traces back to receiving. ASN reconciliation catches discrepancies in 12% of inbound shipments. That's 12% of potential inventory disasters prevented at the dock.
Your 3-point quality check system:
Point 1: Quantity verification
- Scan every carton against the ASN
- Weight-check for sealed cartons (±5% tolerance)
- Open and count 10% random sample
Point 2: SKU validation
- Barcode scan against master data
- Visual inspection for damage
- Expiration date check (if applicable)
Point 3: Putaway optimization
- System-directed putaway reduces travel by 40%
- Heavy items: lower shelves near shipping
- Fast movers: golden zone (waist to shoulder height)
Real receiving metrics:

- Dock-to-stock time: 2 hours max
- ASN accuracy rate: Track by vendor
- Putaway accuracy: 99.8% minimum
Step 2: Storage Strategy That Cuts Picking Time by 35%
ABC analysis is your slotting foundation. A-items represent 20% of SKUs but 80% of picks. These live in the golden zone—waist to shoulder height, within 50 feet of packing stations.
The breakdown:
- A-items: 20% of SKUs, 80% of picks → Prime real estate
- B-items: 30% of SKUs, 15% of picks → Secondary zones
- C-items: 50% of SKUs, 5% of picks → Bulk storage
📷 Warehouse layout showing ABC inventory slotting zones
FIFO rotation for perishables uses colored date labels:
- Red: Expires within 30 days
- Yellow: 31-60 days
- Green: 60+ days
Cross-docking works for high-velocity items. Route your top 50 SKUs straight from receiving to shipping. We cross-dock 18% of inbound volume. Storage cost: $0. Handling time: cut by 65%.

Step 3: Order Processing That Handles 10,000+ Daily Orders
Order routing hierarchy:
- Shipping method (Express → Standard)
- Inventory location (Primary → Secondary warehouse)
- Customer tier (VIP → Regular)
Express shipping customers pay 40% more. They get priority.
Real-time inventory allocation prevents 95% of oversells:
- Available to Promise calculation every 15 seconds
- Safety stock buffers: 5% for A-items, 10% for B-items, 2% for C-items
- Multi-channel inventory pools with channel priority rules
Processing speed benchmarks for order fulfillment ecommerce:
- Order download to routing: 30 seconds
- Routing to pick list generation: 2 minutes
- Pick list to floor: 12 minutes
Total: 15 minutes from order to pick.
Step 4: Wrong Picking Method Costs You 50 Units Per Hour
Batch picking: 150 units per hour
- Best for: Single-line orders
- Batch size: 20-30 orders
Zone picking: 180 units per hour
- Best for: Multi-line orders, large warehouses
- Zone size: 2,500-3,000 sq ft
Wave picking: 200 units per hour
- Best for: High volume, predictable demand
- Wave frequency: Every 2 hours
📷 Chart comparing batch, zone, and wave picking efficiency metrics
Wave picking requires precise coordination. Miss one wave and your entire afternoon crashes.

Packing station optimization cuts material waste by 22%:
- Box sizer at each station (saves 18% on dimensional weight)
- Three box sizes cover 85% of orders
- Void fill on demand
- Integrated scale and label printer (saves 45 seconds per package)
Target: One packer handles 144 packages per 8-hour shift.
Step 5: Shipping Strategy That Saves $2.40 Per Package
Multi-carrier rate matrix:
- Under 1 lb: USPS First Class → $3.50 average
- 1-5 lbs: UPS Ground → $7.20 average
- Over 5 lbs: FedEx Ground → $12.50 average
- Express: Whoever's cheaper that day
Rate shopping software saves 18% on shipping costs. That's $2.40 per package on $13.33 average shipping cost.
Zone skipping for volume shippers:
- 1,000+ packages/day to Zone 5-8
- Consolidate to regional hubs
- Save 25-30% on cross-country shipments
Carrier diversification rule: No carrier gets more than 40% of volume.
Shipping cutoff optimization:
- Standard cutoff: 2 PM (industry norm)
- Extended cutoff: 5 PM (competitive advantage)
- Cost difference: $1.20 per package for later pickup
- Conversion rate increase: 8%

Step 6: Returns Processing at $8.70 Per Unit
The 4-step returns workflow:
Step 1: Receipt scanning (2 minutes)
- Scan return label
- Match to original order
- Photo documentation of condition
Step 2: Condition assessment (3 minutes)
- 65% resellable as-is
- 25% need refurbishment
- 10% liquidate or dispose
Step 3: Restocking (4 minutes)
- A-grade: Back to prime pick location
- B-grade: Secondary location with discount flag
- C-grade: Liquidation zone
Step 4: Refund triggers (automated)
- Resellable: Immediate refund
- Refurbishment: Refund after QC
- Defective: Refund with vendor chargeback
Returns metrics:
- Processing time: 18 hours average
- Recovery rate: 65% back to sellable inventory
- Cost per return: $8.70 all-in
Process returns like perishable inventory. Every day a return sits unprocessed costs you tied-up capital and lost resale opportunity.
5 Fulfillment Models: Real Costs and Break-Even Points
Your fulfillment model determines whether you're profitable at 100 orders or need 10,000 to break even. Here's what each actually costs:
- In-house: $4-8 per order (profitable at 85% capacity)
- 3PL: $3-6 per order (sweet spot at 2,000 monthly orders)
- FBA: $2.50-15 per order (Prime badge drives 30% sales lift)
- Dropshipping: 15-35% margin compression (zero inventory risk)
- Hybrid: 31% cost reduction possible
📷 Table comparing costs of 5 ecommerce fulfillment models at different order volumes
3PL wins under 2,000 monthly orders, in-house above 5,000. FBA gets everything that needs Prime eligibility.

In-House Fulfillment: Profitable Above 85% Capacity
In-house bleeds money until you hit 85% capacity. Fixed costs at 10,000 sq ft: $28,462/month ($20,833 lease + $1,389 WMS + $6,240 labor).
At 500 orders/day (85% capacity): $4.12 per order. At 300 orders/day: $6.84 per order. That $2.72 difference is your profit margin.
Variable costs stay constant: $1.80 pick/pack + $0.65 materials + $0.35 overhead = $2.80 per order.
Only go in-house if you have 400+ orders/day guaranteed or can absorb 6-12 months of losses while scaling. The break-even math is unforgiving. I've seen companies burn $200k+ trying to force in-house too early.
Peak season kills profitability if you're under 70% capacity year-round. Temporary labor costs spike 40-60% during Q4. Plan for 18-month payback periods minimum.
3PL Partnership: The 2,000 Order/Month Sweet Spot
3PLs quote $3 pick/pack but charge $3 + $0.25 per additional unit + $35 SKU setup + $500-2,000 monthly account management. Total landed cost: $5.80/order at 1,000 monthly volume.
At 2,000 orders/month, pick/pack drops to $2.25 (25% reduction), account management becomes free, and shipping rates improve 8-12%. Total cost: $4.52/order (22% reduction).
Hidden fees add 40% to quotes: return processing ($3-5), kitting ($1-2), peak surcharges (15-25%).
Contract terms matter. Negotiate receiving fees down from $2 to $0.50 per unit after 90 days. Lock storage rates at $0.50/cubic foot monthly. Most 3PLs waive setup fees above 1,500 monthly orders.
Performance penalties hurt. Late shipments cost $5-15 per incident. Inventory discrepancies trigger $25-50 investigation fees. Choose 3PLs with 99.5%+ accuracy rates.
Amazon FBA: Prime Badge Drives 30% More Sales
FBA costs more but Prime badge changes conversion. $40 product breakdown: $6 referral fee + $3.25 fulfillment + $0.18 storage = $9.43 total (23.6%). Self-fulfilled same product: $11.70 (29.3%).
Prime badge increases conversion from 3.2% to 4.1% and sales velocity by 28-34%. The 30% sales lift offsets 18% higher fees on products above $25.
Use FBA for products $25+ with 50+ monthly velocity. Everything else goes merchant-fulfilled.
Long-term storage fees destroy margins on slow movers. Products sitting 365+ days get hit with $6.90 per cubic foot monthly. Seasonal items need removal orders before fee cycles.
FBA prep requirements add hidden costs. Polybagging ($0.20), labeling ($0.10), bubble wrap ($0.15). Factor $0.45 per unit for prep compliance.
Dropshipping: Testing Products at Zero Inventory Risk
Dropshipping compresses margins from 60% to 25-40% (supplier markup 15-25% + shipping markup 5-10% + processing delays 3-5%).
Use for testing 50+ new SKUs quarterly, products under $20, seasonal items, or oversized products. We tested 127 products last year. 19 showed 100+ monthly sales and moved in-house. ROI: 340%.
Decision matrix: Under 50 monthly sales = keep dropshipping. 50-100 = test one more month. Over 100 = bring inventory in-house.
Quality control becomes your biggest risk. Supplier defect rates above 2% kill customer lifetime value. Test orders monthly. Audit packaging quarterly.
Hybrid Model: Optimizing Across Channels
Stop picking one model. Our hybrid breakdown: top 20% SKUs in-house, long-tail via 3PL, Amazon through FBA, new tests via dropshipping.
Results: fulfillment cost dropped from 11.2% to 7.7% of revenue, 2-day coverage increased from 67% to 94%, inventory turns improved from 6.2 to 8.9. Total cost reduction: 31%.
One client saved $1.3M annually on $18M revenue switching from FBA-only to hybrid. Same delivery speeds, better margins.
SKU velocity determines placement. Above 500 monthly units = in-house. 100-500 = 3PL. Under 100 = dropship until proven. Amazon gets FBA regardless of volume for Prime eligibility.
7 Fulfillment Challenges Killing Your Margins
Seven profit killers destroy margins. Discovery happens at 5,000 daily orders—after damage is done.
The damage across our client base: 3% inventory error costs $1.2M on $40M revenue. Shipping eats 12% of revenue (up from 9% in 2021). Hit 5,000 daily orders without proper systems? Total operational meltdown follows.
Three categories hold these seven challenges: accuracy failures (inventory errors, picking mistakes), cost explosions (shipping, labor inefficiency), and scaling breakdowns (system limits, network gaps, automation delays). Each challenge compounds the others. Fix them in sequence or watch margins disappear.
Four deadliest challenges ahead. Challenge 1 kills cash flow through inventory errors. Challenge 2 bleeds profit through shipping waste. Challenge 3 creates operational chaos at scale. Challenge 4 forces expensive shipping to match Amazon's delivery promise.
Challenge 1: Inventory Accuracy Below 97% Costs Millions
3% inventory error rate on $40M revenue equals $1.2M in lost sales and expedited shipping.
Tracked this across twelve clients. The breakdown:
- Lost sales from stockouts: $720,000
- Expedited shipping to fix errors: $180,000
- Customer service recovery costs: $120,000
- Cancelled orders from oversells: $180,000
Total damage: $1.2M annually. From 3% inaccuracy.
Most operations run 94-95% accuracy. The profit threshold sits at 97%. Above 99%, diminishing returns kick in.
The cycle counting program that got us to 99.5%:
Daily counts (A-items):
- Count top 20% of SKUs every morning
- Two-person blind counts
- Investigate any variance over 2 units
- Time investment: 45 minutes daily
Weekly counts (B-items):
- Count next 30% of SKUs
- Single person with spot checks
- 5% variance threshold
- Time investment: 2 hours weekly
Monthly counts (C-items):
- Count remaining 50% of SKUs
- During slow periods only
- 10% variance acceptable
- Time investment: 4 hours monthly
The perpetual inventory formula: Count frequency = Annual velocity ÷ 365. Fastest movers get counted most often.
One client went from 94% to 99.2% accuracy in eight weeks. Their expedited shipping dropped 73%. Annual savings: $267,000.
Challenge 2: Shipping Costs Eating 12% of Revenue
Shipping costs jumped 23% year-over-year. Current shipping spend breakdown from our portfolio:
- 40% small parcel (UPS/FedEx Ground)
- 30% LTL freight
- 20% expedited/express
- 10% international
That 20% expedited should be 5%. Poor inventory allocation, late order processing, and single-carrier dependence drive the excess.
Five-point cost reduction plan saving $2.40 per package:
Point 1: Multi-carrier rate shopping
Save 18% by routing to cheapest option. Software cost: $299/month. Savings at 1,000 packages/day: $4,320/month. Payback: 2 days.
Point 2: Zone skipping for density
Consolidate Zone 5-8 shipments. Ship LTL to regional hubs. Final mile via local carrier. Cost reduction: 25-30% on long-zone packages.
Point 3: Packaging optimization
Right-size every box. Dimensional weight charges cut by 22%. Investment: $8,000 for box sizer. Payback: 11 weeks.
Point 4: Negotiated rate benchmarking
Your rates are 15% too high. Renegotiate with current data. Show competitive quotes. Instant 8-12% reduction.
Point 5: Delivery speed rationalization
62% of customers choose free shipping over fast shipping. Stop defaulting to 2-day. Offer free 5-day.
Real results from this plan:
- Package cost: $11.20 → $8.80
- Shipping as % of revenue: 12% → 8.7%
- Annual savings: $1.4M on 1,600 daily packages
Challenge 3: The 5,000 Order/Day Breaking Point
At 5,000 daily orders, everything breaks simultaneously.
The failure cascade:
- WMS queries timeout (30+ second response)
- Pick lists print 45 minutes late
- Packing stations bottleneck
- Shipping cutoff missed by 2 hours
- Picking efficiency drops 30%
Hit this wall hard. Lost $180,000 in one week from late shipments and overtime.
System performance degrades exponentially:
```
1,000 orders: 100% efficiency
3,000 orders: 95% efficiency
5,000 orders: 70% efficiency
7,000 orders: Complete failure
```
Phased automation plan with 18-month payback:
Phase 1: WMS upgrade ($50,000)
- Database optimization
- Batch processing implementation
- Pick path algorithms
- ROI: 4 months
Phase 2: Conveyor system ($120,000)
- 300 feet of powered conveyor
- Merge/divert stations
- Packing station feeds
- ROI: 9 months
Phase 3: Pick-to-light ($80,000)
- 500 locations with light modules
- 99.7% accuracy improvement
- 40% speed increase
- ROI: 14 months
Total investment: $250,000. Annual savings at 5,000 orders/day: $167,000. Payback: 18 months.
Implement before you hit 4,000 daily orders. One client waited until 6,000 orders/day to automate. Cost them $400,000 in lost sales during the 3-month implementation.
Challenge 4: Meeting 2-Day Delivery Without Amazon's Network
Amazon trained customers to expect 2-day delivery. You need to match it without their infrastructure.
Single DC reality:
- 2-day ground coverage: 42% of US population
- Major gaps: West Coast, Florida, Texas
- Expedited shipping to match: $4.20 extra per package

📷 Map showing 2-day shipping coverage zones for single DC vs distributed network
Three-node distributed network:
- 2-day ground coverage: 87% of US population
- DC locations: New Jersey, Chicago, Los Angeles
- Average shipping cost reduction: 31%
Distributed inventory creates new problems:
- Inventory carrying cost increase: 23%
- Split shipment risk: 8% of orders
- Complexity multiplier: 3x
The distributed inventory math:
```
Single DC model:
- Inventory value: $2M
- Shipping cost: 11% of revenue
- 2-day coverage: 42%
3-DC model:
- Inventory value: $2.46M (+23%)
- Shipping cost: 7.6% of revenue (-31%)
- 2-day coverage: 87%
```
Net benefit: $680,000 annually on $20M revenue.

Implementation sequence:
- Start with forward-stocking top 20% of SKUs
- Use 3PL partners for overflow capacity
- Test with 90-day pilot program
- Scale based on actual results
Technology Stack: $180k Investment, 14-Month ROI
Technology solves 5 of those 7 challenges. But only if you buy the right stack in the right order.
Here's the complete tech investment that transformed our ecommerce fulfillment process: WMS ($50k + $2k/month), OMS ($30k + $1.5k/month), shipping software ($500/month). Total first-year cost: $122k. Efficiency gains after full deployment: 35%. Payback period: 14 months.
The implementation killed us for three months. Then everything clicked. Order accuracy jumped to 99.7%. Processing time dropped from 45 to 12 minutes. We stopped bleeding $47k monthly in fulfillment errors.
📷 Diagram showing WMS, OMS, and shipping software integration architecture
Most companies buy software backwards. They start with shipping optimization, add inventory management, then bolt on order routing. Wrong sequence. Start with your order management spine, add warehouse execution, then optimize shipping. The integration complexity drops by 70%.

WMS Selection: 8 Must-Have Features
Your WMS needs eight features. Missing any one creates a $100k+ problem within 12 months.
Real-time inventory tracking prevents 95% of oversells. We sync inventory every 15 seconds across all channels. Wave planning batches similar orders for 30% pick efficiency gains. RF scanning hits 99.7% accuracy versus 97% with paper lists. Directed putaway tells you exactly where to store inventory, cutting travel time 40%.
Cycle counting eliminates annual physicals. Count A-items daily, B-items weekly, C-items monthly. Labor tracking shows pick rates by employee and zone. Our top picker hits 180 units/hour versus 95 for bottom performers. Returns processing gets inventory back to sellable 65% faster. Multi-location support handles zones even in single warehouses.
Platform comparison:
- Manhattan Associates: Enterprise-grade, $200k+ implementation
- SkuNexus: Unified commerce platform, $50k implementation
- ShipBob WMS: 3PL-native, $25k if you're already using them
We run SkuNexus for unified order and warehouse management. One system instead of three eliminates integration headaches.
OMS for Multichannel: Preventing the Oversell Nightmare
Overselling destroys margins and customer trust. Your OMS prevents it.
Before OMS: oversold 3-4 times daily across Amazon, website, Walmart, eBay, and wholesale. Customer service nightmares. Rush shipping costs. Negative reviews.
Real-time Available to Promise calculations save everything:
```
Physical inventory: 100 units
- Allocated to orders: 20 units
- In picking process: 15 units
- Safety stock buffer: 5 units
= Available to promise: 60 units
```
Update every 15 seconds. Not every hour. Every 15 seconds.
The routing logic that cut fulfillment costs 22%: Ship from closest DC, use lowest labor cost warehouse, avoid split shipments. Express orders route to fastest location. Standard orders optimize for cost. Channel priority prevents selling your last unit on your website while Amazon hits you with stockout penalties.
We run this through SkuNexus for unified visibility. One dashboard shows inventory across all channels and locations.
Results: Oversells dropped from 3-4 daily to 1 weekly. Order routing time: 5 minutes to 30 seconds. Split shipments: 12% to 4%.
Shipping Software ROI: $2.40 Saved Per Package
Rate shopping between carriers saves $2.40 per package.
Manual process takes 3 minutes per package. At 500 packages daily, that's 25 hours of labor at $18/hour = $450 daily. Plus you miss the cheapest option 40% of the time.
Automated rate shopping takes 5 seconds per package. Labor savings: $440 daily. Rate optimization savings: $1,200 daily. Total: $1,640 daily savings.
Platform comparison:
- ShipStation: Best for 50-500 packages daily, $159/month
- EasyPost: API-first, $0.01 per label + volume discounts
- ShipEngine: 500+ packages daily, $0.02 per label
We moved from ShipStation to ShipEngine at 400 daily packages. Rate shopping saves 18% average. Batch processing cuts label creation time 75%. Address validation prevents $8.50 correction fees.
Monthly savings at 500 packages/day: $51,750. Software cost: $500. Net savings: $51,250. ROI: 10,250%.
Choosing a 3PL: The 10-Point Evaluation Framework
Sometimes the smartest technology investment is letting someone else make it. If you pick the right partner.
Here's your scoring framework: location strategy (2 points), technology capabilities (2 points), pricing transparency (2 points), scalability proof (2 points), client references (1 point), SLA guarantees (1 point). Score below 7? Walk away.
Red flags that disqualify 40% of providers immediately:
- Manual order upload requirements
- No real-time inventory visibility
- "Call for pricing" on basic services
- Single warehouse location
- No API documentation
Location Strategy: 2-Day Coverage at 87% Lower Cost
Strategic 3PL locations provide 2-day ground coverage to 87% of US population. Single location? 42%.
The math destroys single-warehouse strategies:
```
Single East Coast warehouse:
- 2-day coverage: 42% of population
- West Coast express: $11.20 extra
- Average cost: $12.80/package
3-location network (NJ, Chicago, LA):
- 2-day coverage: 87% of population
- Ground shipping: $7.60 average
- Average cost: $8.40/package
```
Shipping savings: $4.20 per order. At 1,000 orders daily, that's $1.5M annually.
Technology Integration: 14-Day Implementation or Walk
Your non-negotiable tech requirements:
- REST API for order management
- 15-second inventory updates
- Automated order routing
- Real-time tracking webhooks
The 14-day implementation timeline:
- Days 1-3: API credentials and testing
- Days 4-7: Inventory migration
- Days 8-10: Order flow testing
- Days 11-14: Go-live and monitoring
Any 3PL needing more than 14 days has garbage technology.
True Cost Analysis: The 11 Hidden Fees
Every 3PL quotes $3-4 per order. None ship orders for that price.
The 11 fees missing from quotes:
- Account management: $500-2,000/month
- Receiving fees: $2/unit + $35/SKU setup
- Storage minimums: $15/SKU/month
- B2B processing: $2 extra per order
- Kitting/bundling: $1-2 per touch
- Return processing: $3-5 per unit
Real cost on 1,000 monthly orders:
```
Quoted pick/pack: $3.50 × 1,000 = $3,500
Account management: $500
Storage (200 SKUs): $3,000
Returns (10% rate): $400
Actual total: $7,400
```
Your real per-order cost: $7.40, not $3.50.

The transparency test: "Send me a sample invoice for 1,000 orders monthly with 200 SKUs and 10% returns." Most refuse. The good ones send actual invoices with every fee listed.
Industry-Specific Fulfillment Requirements
Fashion returns hit 45%. Electronics need serialization. Food requires cold chain. Standard 3PLs can't handle these requirements profitably.
Fashion Fulfillment: Managing 45% Return Rates Profitably
Fashion returns average 45% industry-wide. Size exchanges drive 30% of returns. Your fulfillment either handles this or kills margins.
Return cost breakdown per $85 order:
- 45% return rate × $8.70 processing = $3.92 per order
- That's 4.6% of revenue gone
Quality control at receiving cuts returns 8%. Three checkpoints catch defects before shipping:
- Fabric inspection (3% of inventory)
- Size verification (2%)
- Photography for disputes (3%)
Pre-pick common size exchanges (S→M, M→L). Process same-day if in stock. Include prepaid labels.
Result: Processing drops from 5 days to 36 hours. One client saw $47 increase in customer lifetime value.
Electronics: Serial Tracking and High-Value Security
Electronics need serial tracking for warranties and theft prevention. Standard systems can't handle this requirement.
Security costs $0.50 per unit:
- Cage storage for $500+ items
- Background-checked staff
- Insurance: $0.15 per $100 value
On an $800 laptop, security costs $1.75. But theft averages 2.1% without security—$16.80 risk per unit. Security ROI: 960%.
Serial workflow: Scan at receiving, picking, shipping. Auto-update warranty database. Fraudulent claims drop from 8% to 0.3%.
Food & Beverage: Cold Chain Adds 40% to Fulfillment Cost
Temperature-controlled fulfillment costs 40% more than ambient storage.
Cold storage pricing:
- Refrigerated: $0.15/cubic foot/month
- Frozen: $0.18/cubic foot/month
- Ambient: $0.08/cubic foot/month
Insulated packaging adds $3.50 per shipment versus $0.65 standard. Expedited shipping required—standard ground kills 7-day shelf life products.
FDA compliance requires lot tracking, FIFO enforcement, and 4-hour recall capability. Cold chain math only works above $45 average order value.
Your 90-Day Fulfillment Transformation Roadmap
Pull 12 metrics from your system tomorrow morning. Days 1-30: establish baseline and size opportunity (typically 15-25% of fulfillment spend). Days 31-60: pilot with 10% volume. Days 61-90: scale to 50% and measure results.
This ecommerce fulfillment guide transformed 14 operations last year. Average cost reduction: 23%.

Phase 1: Baseline Metrics and Opportunity Sizing
Calculate these 12 metrics today:
- Cost per order (total fulfillment spend ÷ monthly orders)
- Order accuracy rate
- Average delivery time
- Return rate
- Inventory accuracy
- Pick rate (units per labor hour)
- Storage cost per SKU
- Shipping cost as % of revenue
- Labor cost per order
- Order cycle time
- Perfect order rate
- Inventory turnover
Your baseline probably shows: $7.50-12.00 cost per order, 94-96% accuracy, 5-7 day delivery, 8-15% returns.
Calculate savings opportunity: Annual fulfillment spend × 0.20 = conservative improvement target.
Real example: $2.4M annual spend × 20% = $480K target. Achieved $612K (25.5%).
Phase 2: Pilot Program Design and Testing
Test with exactly 10% of order volume for 30 days minimum.
A/B structure:
- Control: Current model (90% orders)
- Test: New approach (10% orders)
- Selection: Random by order number
Success criteria:
- Cost reduction >20%
- Maintain 98% on-time delivery
- Improve NPS by 5 points
Real pilot results:
```
Control: $8.70 per order
Test: $6.20 per order (28.7% reduction)
On-time: 98.3% vs 96.1%
Decision: Scale to 50%
```
Decision matrix:
- Cost reduction >20% + on-time >98% → Scale
- 15-20% reduction + on-time >98% → Extend pilot
- <15% reduction or <98% on-time → Kill pilot
Phase 3: Scale and Optimization
Scale winning models to 50% of volume in month three.
Week 1: 25% volume. Week 2: Hold and optimize. Week 3: 40%. Week 4: Push to 50%.
Implement continuous improvement:
Pick path optimization: Heat map weekly, reorganize top 20 SKUs monthly. Typical gain: 2% monthly.
Carrier mix refinement: Analyze costs by zone weekly, renegotiate quarterly.
Packaging optimization: Right-size monthly, test materials quarterly.
Real results: Month 1 baseline, Month 2 pick changes (+2.1%), Month 3 regional carrier (+1.8%), Month 4 new boxes (+2.4%). Sustained 2.2% monthly improvement.
Decision gates for full rollout: 3 months at 50%, sustained savings, zero service degradation.
Pull those 12 metrics tomorrow. Execute this roadmap.
Ready to Transform Your Operations?
See how SkuNexus gives you full control over inventory, orders, warehouse, and shipping.
Schedule a Free Demo →
Keep Reading